
The SWEEP Heat Pump Cost calculator is designed to provide homeowners with information on the relative heating costs of heat pumps compared to gas furnaces, to help them make a more informed heat pump decision. It may also help utilities, or state/local governments improve programs and campaigns that promote residential heat pumps. The calculator was developed by NTS Energy LLC, Boulder Colorado.
This summary describes how the calculator works, including the main assumptions.
Key Points About the Calculator:
- The calculator is meant for single-family homes or duplexes.
- It calculates the percentage of heating cost savings (or increase in costs) for two or three heat pump system options, compared to the home’s existing (standard efficiency) gas furnace, and
- The calculator also estimates the percentage of cooling cost savings for the heat pump systems compared to the home’s existing (standard efficiency) air conditioning (AC) system.
- It also calculates the percentage of greenhouse gas emission reductions for the heat pump systems compared to the existing gas furnace.
- We designed the calculator to be independent of size, age, and efficiency of the home’s shell (air sealing and insulation). This greatly simplifies the inputs and assumptions.
- For this initial version, the calculator will do the above calculations for homes in 16 states (discussed below).
- We assume most users of the calculator are interested in the potential benefits of adding a heat pump to an existing home. However, the calculator also provides the above information for new homes. This could be useful for builders, new homebuyers, or policy-makers interested in the benefits of “high-performance” new homes with a heat pump system.
Key Factors and Calculator Inputs
From SWEEP’s previous studies of heat pump costs and benefits, we learned that there are three main factors that determine whether or not heat pumps reduce annual heating costs compared to gas heating:
- Energy price ratio: the ratio of the customer’s electricity price to gas price.
- Equipment choices: the type and efficiency of the heat pump system and efficiency of the gas furnace.
- Climate zone/weather data for the customer’s home.
Based on these factors, we designed the calculator to only require three inputs:
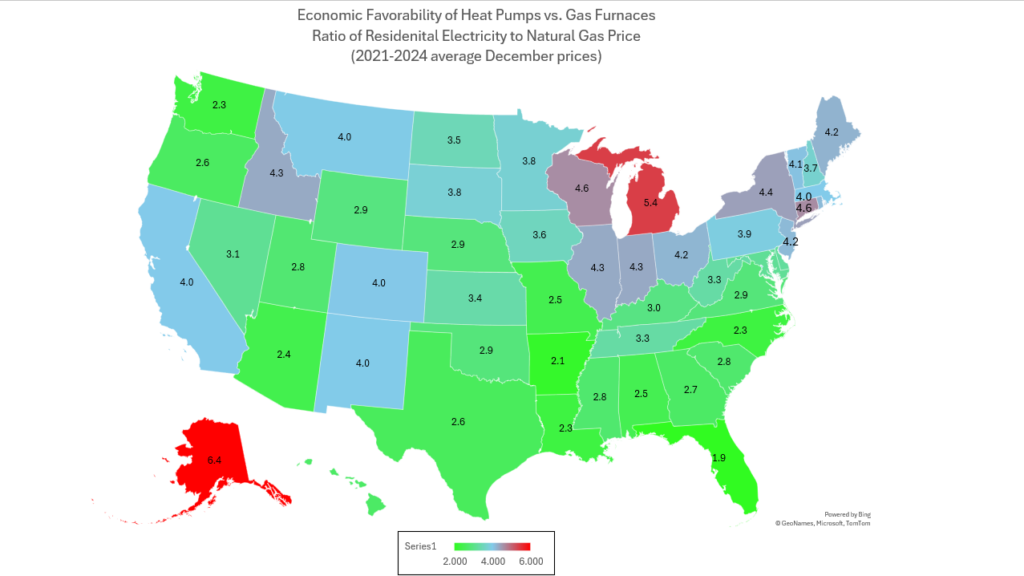
- State. There are 16 states allowed currently, with default energy prices as explained below. (For other states, users can consult the map provided here (insert link) showing the state’s energy price ratio, which will help indicate heat pump system cost-effectiveness. This is explained further below.)
- Climate zone. In the drop-down menu, the calculator provides several choices of climate zones for each state.
- Existing vs. new home. The user selects “existing home replacement” or “new home system” from the drop-down menu. There is also an option for “total house remodel,” for which the calculator essentially provides the same information as for the new home scenario.
With these inputs, the calculator then provides the percentage energy cost savings and GHG emission reductions, as described above.
Energy Prices
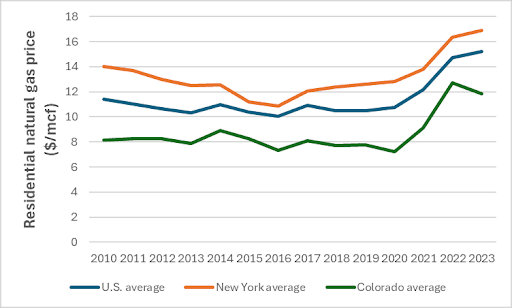
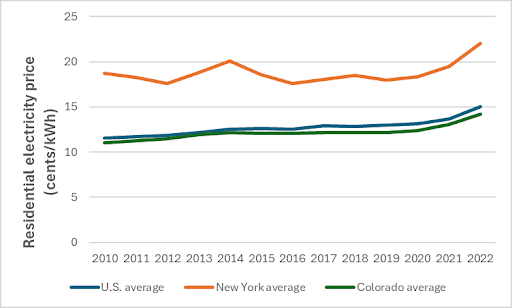
Along with equipment selection, the most important factor in determining the heating costs for heat pumps is the ratio of electricity to gas price. If we look at residential electricity prices over the last 13 years, we generally see a fairly steady increase in prices from one year to the next. Residential natural gas prices, on the other hand, are much more volatile, jumping up and down erratically from one year to the next. (See Figures 1 and 2.1)
The U.S. Energy Information Administration (EIA) provides annual data on state average residential electricity and gas prices. It is also possible to find current utility residential electricity and gas prices, but it is very difficult to find this data for previous years. Therefore, we came up with the following methodology for incorporating energy prices into the calculator:
- From EIA data, we found the residential gas price for each state we modeled, and we calculated the average for the last four years (2021-2024). (More specifically, we found the average of the gas prices for December of each of these years.2) These are the three years since the end of the pandemic, during which gas prices were much lower. Because of gas price volatility, choosing the 4-year average is a better indicator of future gas prices than choosing the most recent year.
- For electricity, we also used EIA data, and we calculated the average for the last four years, using the December monthly electricity price for 2021-2024, to be consistent with our gas price method just described.
Figure 1 – Residential Natural Gas Prices
Figure 2 – Residential Electricity Prices
The calculator also allows a homeowner (or any calculator user) to input more specific recent electricity and gas rates from their utility. The calculator suggests the user input their most recent December electricity and gas price if either is more than 7% higher or lower than the state average value from EIA3. The calculator uses the customer’s gas and electricity price to adjust the four-year average value for each4.
1. Data for figures 1 and 2 are from EIA: https://www.eia.gov/electricity/data.php for electricity prices, and https://www.eia.gov/dnav/ng/ng_pri_sum_a_EPG0_PRS_DMcf_m.htm for natural gas prices.
2. The December monthly price is a very good choice for estimating the annual heating costs. It is simpler to choose one month than an average of three (such as December through February). December’s gas price is generally close to the average for these three winter months; the key point is to choose the same month for each year.
3. We chose 7% because 10% seems too large, and 5% seems too small.
4. For example, if the customer’s December 2023 gas price is 20% higher than the December 2023 EIA default gas price, then the calculator would increase the three-year average gas price (from the EIA data) by 20% and use that value in the estimation of heating cost savings. Adjusting the 3-year average in this way provides a more meaningful and accurate result than using the customer’s one-year gas and electricity price.
Climate Zones and Heat Pump System Types
For the states and climate zones in the calculator, we chose a city to represent the most prevalent climate zone in each state, and we used weather data for that city to evaluate the energy consumption and performance of the heat pump. For example, for Colorado, we chose Denver to represent climate zone 5B. For New York, we chose Albany, New York to represent zone 5A and New York City to represent zone 4A.
Based on our experience, the table below highlights our recommendations for heat pump system types for the various climate zones. It also provides the efficiency specifications we used in modeling the performance. These systems balance the trade-offs between annual heating costs, installation costs, and maximizing the greenhouse gas (GHG) emission benefits.
| Heat Pump System | Specifications | Climate Zones | Comments |
|---|---|---|---|
| T1ES – Tier 1 heat pump (HP) with electric strip backup heating | Energy Star minimum efficiency requirements: HSPF2 7.8+, SEER2 15.2+; changeover temperature to electric strip of 15 F. | 2 or 3 | A backup furnace is not required for zones 2 and 3. |
| T2ES – Tier 2 HP with electric strip backup heating | Energy Star “most efficient” requirements: HSPF2 8.1+, SEER2 16.9+; changeover temperature to electric strip of 15 F. | 2, 3, or 4 | Tier 2 is a slightly more efficient HP than Tier 1, with slightly higher initial cost. For zone 4, we recommend also comparing T2GF and CCES. |
| T1GF – Tier 1 HP with gas furnace backup heating | See Tier 1 specs above; we recommend a changeover temperature to the gas furnace of 30 F. | 4 or 5 | For zones 4 and 5, having a backup furnace will reduce the annual heating costs slightly, and will also reduce the initial costs compared to CCES. |
| T2GF – Tier 2 HP with gas furnace backup heating | See Tier 2 specs above; we recommend a changeover temperature to the gas furnace of 30 F. | 4, 5, or 6 | This system will have slightly lower heating costs than T1GF, with slightly higher initial cost. |
| CCES – Cold-climate, ducted whole house HP with electric strip supplemental heating | Variable-speed compressor, SEER2 19.5, HSPF2 8.5; changeover temperature to electric strip of -5 F. | 4 or 5 | This system will have similar heating costs compared to T2GF, with higher initial costs. |
| CCGFX – Cold-climate whole house with gas furnace supplemental heating | See cold-climate specs above; changeover temperature to gas furnace of 15 F. | 6 or 7 | This system will have similar heating costs to the T2GF system, with greater GHG emission benefits. We recommend this system only for existing homes. |
| CCGF – Cold climate whole house with gas furnace supplemental heating | Same cold-climate specs as for CCGFX above (SEER2 19.5, HSPF2 8.5); but for new homes, we recommend a changeover temperature of 5 degrees F rather than 15 F, to maximize the GHG reduction benefits. | 6 or 7 | The gas furnace backup will reduce heating costs compared to CCES for zone 6. We recommend this system for new homes. (We do not recommend CCES or CCMSES for zone 7.) |
| CCMSES – Energy Star very high efficiency cold climate ducted or mini-split system, with electric supplemental heating | SEER2 21.8, HSPF2 9.8 | 5 or 6 | This system will have lower heating costs than CCES, with slightly higher initial costs. Because it’s more expensive, we only recommend CCMSES for new homes. |
Other States Not in the Calculator
As discussed above, there are 16 states in the calculator: six southwest states (AZ, CO, NM, NV, UT, and WY), and the 10 states with the highest residential gas consumption, listed below.
States with Highest Residential Gas Consumption:
- New York
- California
- Illinois
- Michigan
- Ohio
- New Jersey
- Pennsylvania
- Texas
- Minnesota
- Wisconsin
For states other than these 16, the map below will help indicate the economic favorability of heat pumps. Many heat pump systems have a coefficient of performance (or “COP,” a measure of efficiency) of 3.1 or greater. Assuming a COP of 3.1 or greater, the heat pump’s heating costs will be the same or less than the heating costs with an existing gas furnace, for any state with an energy price ratio of 3.9 or less.
Details of Energy Modeling
To model the performance of the heat pump systems and furnace systems, we used Wrightsoft Right-Suite Universal 2023, version 23.0.5.
The relative heating costs computed by the calculator are not dependent on the house size or construction quality and total energy for heating (Btu’s) per year. For the modeling, we used a fixed value for the home’s heating needs of 23,000,000 Btu/yr.
We made the following additional assumptions:
- A building model with a three-ton load at 0 F for Denver, Colorado was used as the standard home for all of the modeling.
- For each state and climate zone, a representative city was selected, and the ASHRAE 2021 climate data was used in the modeling.
For all the heating systems modeled, Wrightsoft provides the annual electricity consumption and gas consumption (for gas furnaces).
Heating Systems Modeled
For each state and climate zone, two baseline systems were modeled to determine the energy required to provide the annual heating for each:
- An American Standard L9X – Model value: AFUE 95% (AHRI 207175365)
- An Ameristar 100% AFUE electric furnace.
The heat pump systems modeled were:
- Tier 1 HP system: Carrier 25TPA (AHRI 212325186). Modeling values: SEER2 16. HSPF2 7.8.
a. Tier 1 heat pump with gas furnace (T1GF) – American Standard furnace as above.
b. Tier 1 heat pump with 15 kW electric strip supplemental (T1ES). - Tier 2 HP system: Carrier 2 stage 25TPA (AHRI 207863629). Modeling values: SEER2 17. HSPF2 8.0.
a. Tier 2 heat pump with gas furnace (T2GF) – American Standard furnace as above.
b. Tier 2 heat pump with 15 kW electric strip supplemental (T2ES). - Cold-climate whole house heat pump (CCGF or CCES): York YZV (AHRI 211010175). Modeling values: SEER2 19.5, HSPF2 8.5.
a. Cold-climate whole house heat pump, with 15kW electric strip supplemental (CCES).
b. Cold-climate whole house heat pump, with gas furnace. (CCGF). American Standard furnace as above. - Cold-climate very high efficiency heat pump (CCMSES): Lennox SL25XPV (AHRI 207436541). Modeling values: SEER2 21.8, HSPF2 9.8.
Heating Costs Methodology
Gas Furnace System Cost Calculation
The annual heating cost is calculated as follows:
- Total annual therms = (total annual Btu for heating) / 100,000 Btu/therm * furnace efficiency (.95)
- Gas cost per year = therms * price (this is either EIA state average or user input)
- System electricity used to run fan, etc. (in kWh) = .75 * number of therms
This ratio of kWh to therms is an average value for 95% AFUE furnaces with two-speed fans, between the values for variable-speed and single-speed fans.
Electricity cost = annual electricity consumption (kWh) * price ((this is either EIA state average or user input)
Heat Pumps Systems with Electric Supplemental Cost Calculation
The annual cost is calculated as follows:
- Total annual kWh electric furnace = annual heating needed (Btu) / (3412 Btu/kWh * .968) (slight efficiency loss for electric furnace)
- Heat pump system electricity use = electric furnace total kWh / COP (for state and climate zone)
- Electricity cost = total kWh * price (this is either EIA state average or user input)
Heat Pumps Systems with Gas Furnace Supplemental Cost Calculation
The annual cost is calculated as follows:
- Total annual kWh electric furnace = total heating needs (Btu) / (3412 btu/kWh * .968) (slight efficiency loss for electric furnace)
- Heat pump system electricity use = electric furnace total kWh / RCOP (for state and climate zone)
- Electricity cost = total kWh * price (this is either EIA state average or user input)
- Annual gas use for heat pump = Gas furnace system annual use * % gas use by heat pump system (for state, climate zone and heat pump system)
- Gas cost per year = therms * price (this is either EIA state average or user input)
Percent Annual Heating Bill Savings
This is calculated as:
- 1 – (heat pump system heating cost/gas system heating cost)
User Input Gas Cost Price Adjustment
To estimate the 4-year average NG price when the user inputs the most recent year, we compare the most recent year EIA price and the user input price. We then adjust as follows:
- Estimated user 4-year average price = EIA 4-year average price * user recent year price/EIA recent year price.